前言
最近在研究vtune,试着用其进行代码性能的分析,主要看了snapshot和hotspot两个analysis type。
vtune的安装可以使用官方的docker,或者自己安装oneAPI。我使用的是apt install,脚本如下。
1
2
3
4
5
6
7
8
9
10
11
12
13
apt-get install -y --no-install-recommends curl ca-certificates gpg-agent software-properties-common

# download the key to system keyring
wget -O- https://apt.repos.intel.com/intel-gpg-keys/GPG-PUB-KEY-INTEL-SW-PRODUCTS.PUB | gpg --dearmor | tee /usr/share/keyrings/oneapi-archive-keyring.gpg > /dev/null

# add signed entry to apt sources and configure the APT client to use Intel repository:
echo "deb [signed-by=/usr/share/keyrings/oneapi-archive-keyring.gpg] https://apt.repos.intel.com/oneapi all main" | tee /etc/apt/sources.list.d/oneAPI.list

# install base kit and hpc kit
apt update && apt install intel-basekit intel-hpckit -y

# source vtune env
echo "source /opt/intel/oneapi/vtune/latest/vtune-vars.sh" >> ~/.bashrc
用法
因为代码运行往往在远程服务器上,一般来说是没有GUI的,因此我们采取的方式是在远端我们使用CLI进行分析,将分析结果在本地机器上可视化。
命令可以用vtune -h查看:
1
2
3
4
5
#  1) Start with a performance snapshot. Get a quick overview of potential performance issues. Identify next steps for a deeper analysis:
vtune -collect performance-snapshot a.out

#  2) Run a hotspots collection (in user-mode sampling) on the specified target:
vtune -collect hotspots a.out
Performance Snapshot
IPC:代表了CPU每个时钟周期完成(retired)的指令数目。现代处理器的指令运行都是流水线(pipeline)的形式,每个(汇编)指令可分为取指、译码、执行等多条指令(uOPs),通过并行这些指令可以实现大于1的IPC。
Instructions Retired per Cycle, or IPC shows average number of retired instructions per cycle. Modern superscalar processors issue up to four instructions per cycle, suggesting a theoretical best IPC of 4. But various effects (long-latency memory, floating-point, or SIMD operations; non-retired instructions due to branch mispredictions; instruction starvation in the front-end) tend to pull the observed IPC down. A IPC > 1 is typical for instruction bound code, while a IPC < 1 may show up for a stall cycle bound application, also likely memory bound. IPC is an excellent metric for judging an overall potential for application performance tuning.
Retiring:在CPU的指令控制单元(Instruction Control Unit)中,retirement unit记录正在进行的处理。一旦一条指令的操作完成了,而且所有引起这条指令的分支点也都被确认为预测正确,那么这条指令就可以retired了。Retiring的值越高,说明指令的利用率越高。
Retiring metric represents a Pipeline Slots fraction utilized by useful work, meaning the issued uOps that eventually get retired. Ideally, all Pipeline Slots would be attributed to the Retiring category. Retiring of 100% would indicate the maximum possible number of uOps retired per cycle has been achieved. Maximizing Retiring typically increases the Instruction-Per-Cycle metric. Note that a high Retiring value does not necessary mean no more room for performance improvement. For example, Microcode assists are categorized under Retiring. They hurt performance and can often be avoided.
Vectorization:代表向量化指令的占比(vaddps, …)。
This metric represents the percentage of packed (vectorized) floating point operations. 0% means that the code is fully scalar. The metric does not take into account the actual vector length that was used by the code for vector instructions. So if the code is fully vectorized and uses a legacy instruction set that loaded only half a vector length, the Vectorization metric shows 100%.
Hotspot
通过hotspot可以让我们从多个角度去分析程序不同位置的时间消耗,包括:
- top down
- caller
- bottom up
- flame graph
- …
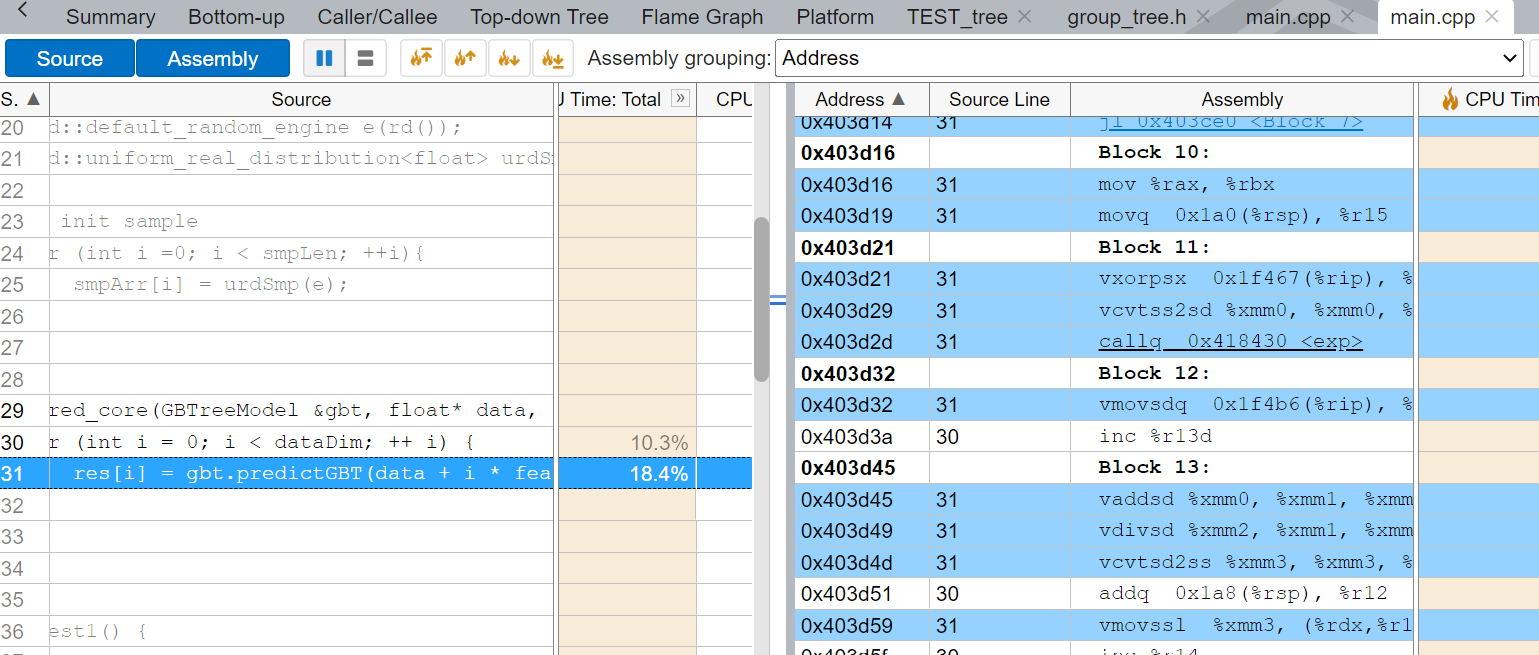
通过点击相应的函数你可以直接看到对应的代码行的占用时间,以及对应的汇编代码(如下图)
有时候,你会发现你所需要分析的代码仅仅只是庞大代码中的一小部分,这时候该怎么办?Instrumentation and Tracing Technology API提供了相应的解决方案。
结论
通过vtune我们可以很清晰的了解到每个函数,特定行的时间占比,通过top down的Performance Snapshote,可以帮助我们从较高维度理解程序性能,为之后的优化指明方向。